
A Picture is Worth 1,000 Words
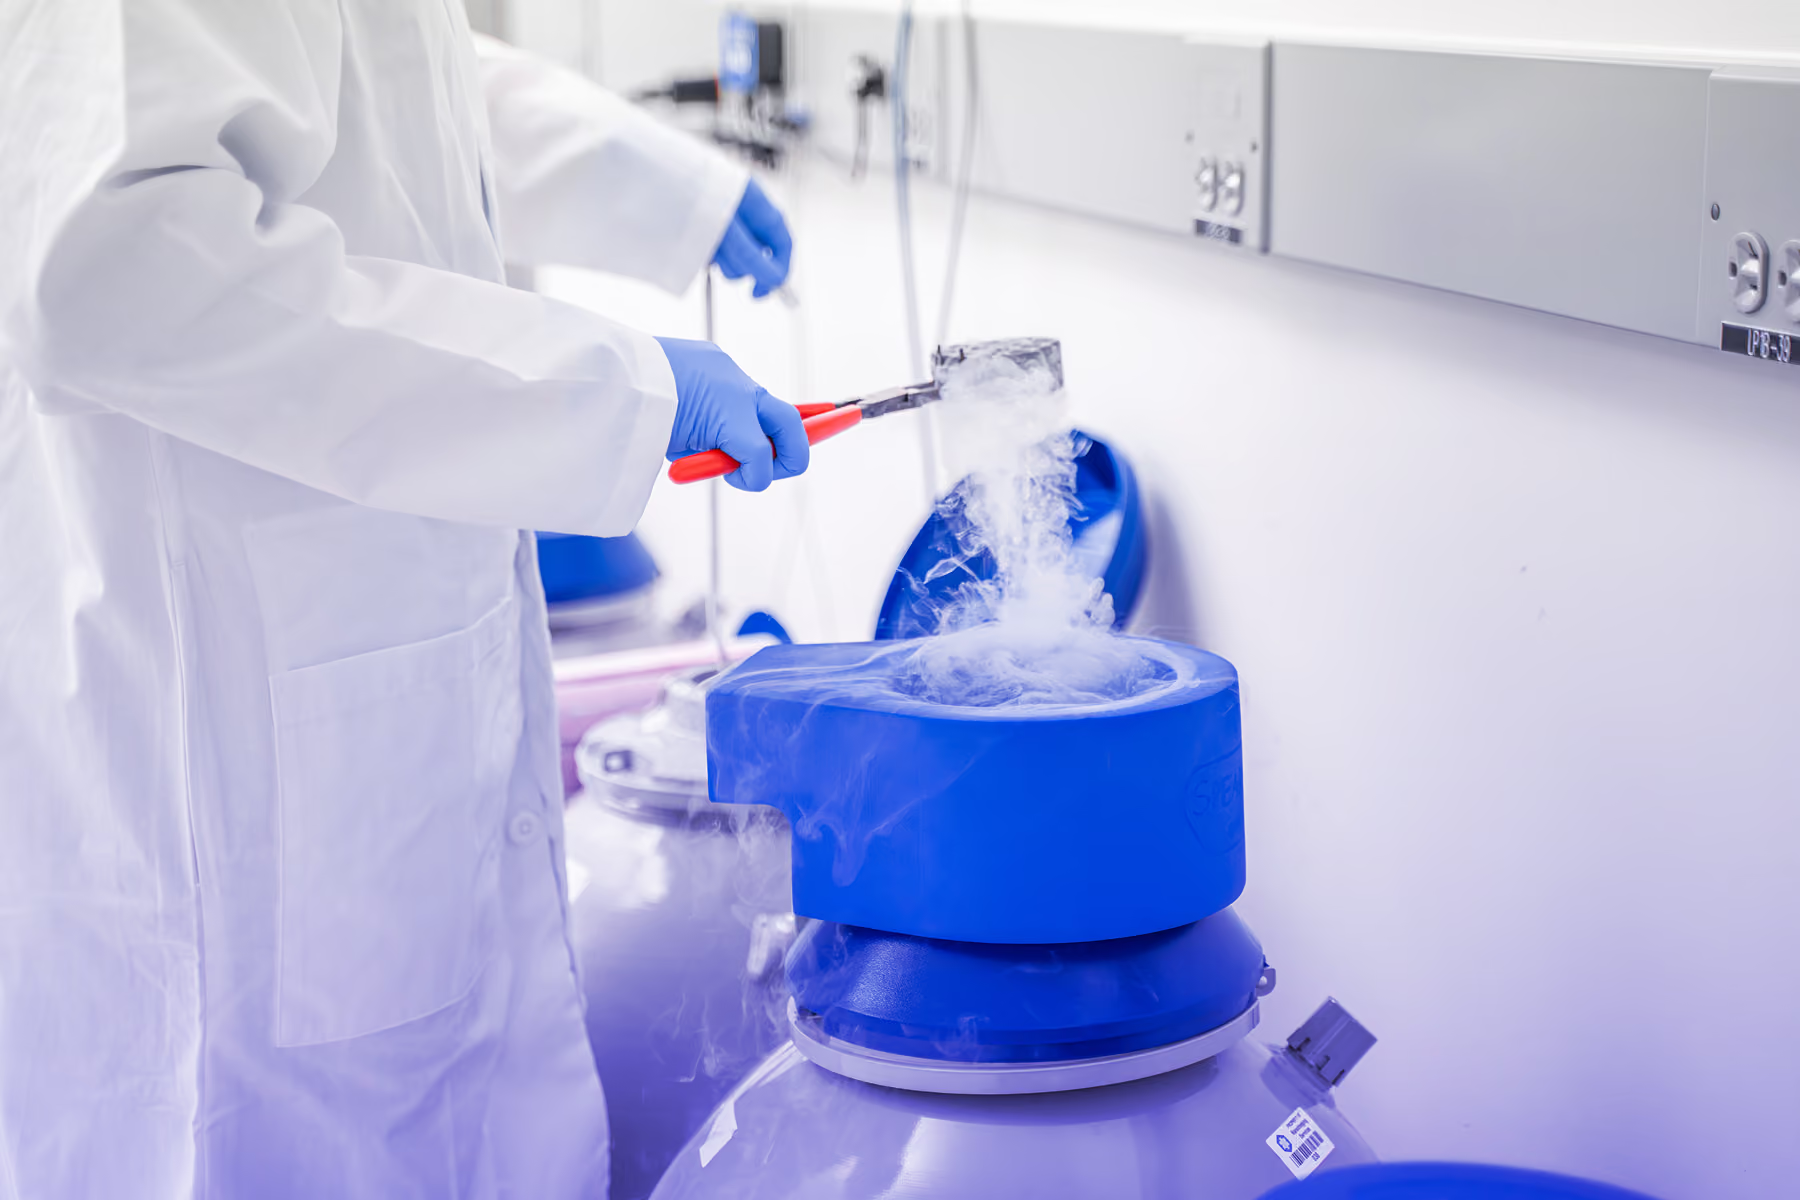
Cryogenic Transmission Electron Microscopy (Cryo-TEM) is an essential tool for nanoparticle characterization, offering both quantitative and qualitative insights into your formulation in a single study, with only ~50μl of sample.
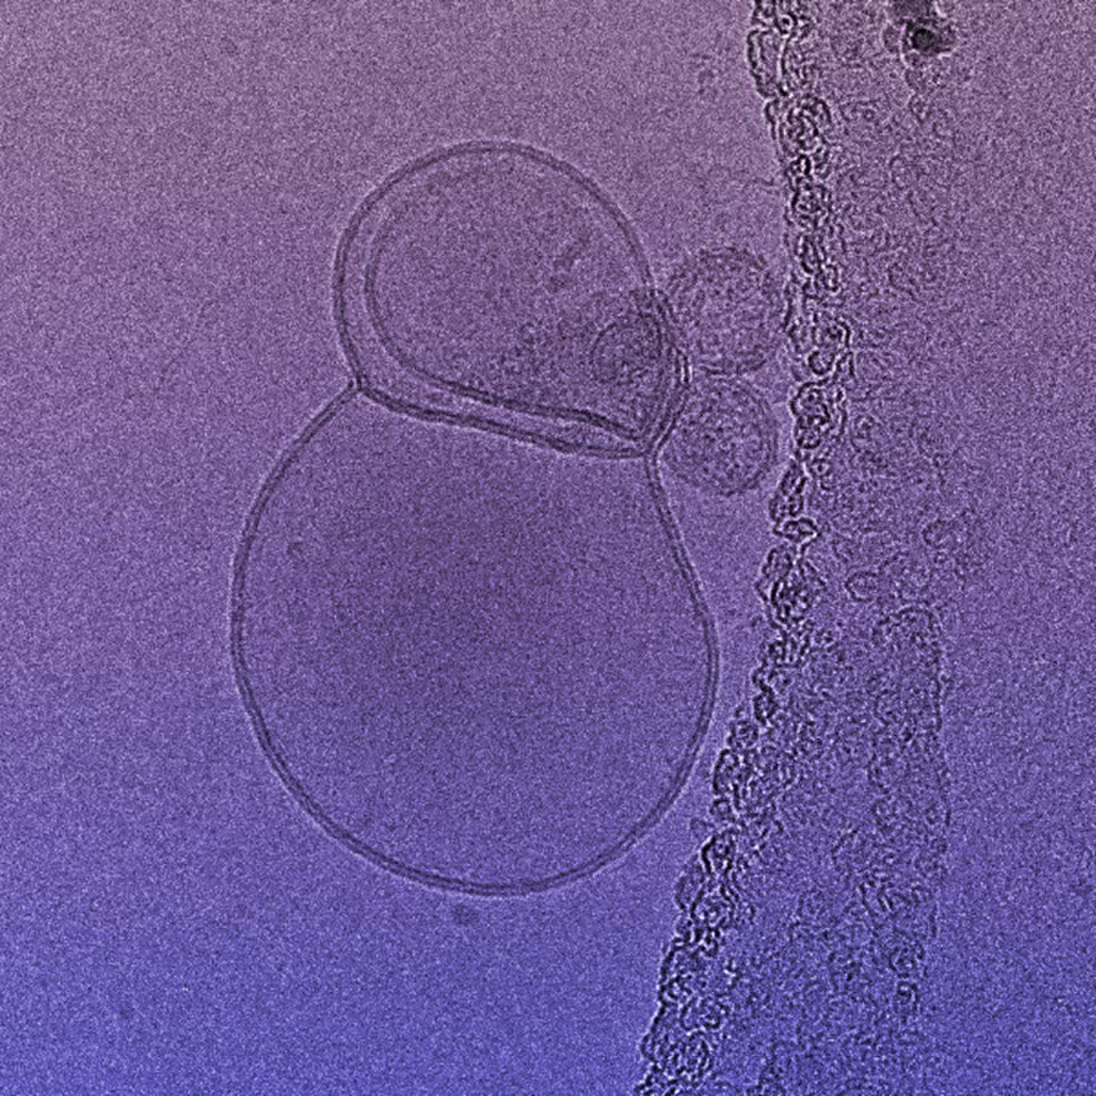
Cryo-TEM imaging uncovers quality attributes (QAs) that other techniques may overlook, providing a deeper understanding of your nanoparticles. Nanoparticle size, shape, lamellarity, and morphology affect drug incorporation, stability, and release, which in turn affect cell toxicity, targeting, and therapeutic efficacy.
One Study, Multiple Answers
Cryo-TEM imaging and automated analysis reveals QAs including:
- Particle size distribution
- Drug and payload encapsulation and distribution
- Morphology; including shape, circularity, lamellarity, and blebbing
- Sample integrity and impurities and aggregation
Size & Shape
Automated particle segmentation and sizing provides precise particle size distribution measurement. Analysis includes:
- Size (AED, min/max feret diameters)
- Size distribution (D10, D50, D90, SPAN)
- Shape (Aspect ratio, Circularity)
- Aspect ratio
- Circularity
Cryo-TEM can unveil many aspects of a sample simultaneously, in a single image (particle size distribution, drug encapsulation, shape, morphology, impurities, and integrity, along with measuring circularity and aspect ratio), all with a tiny amount of sample. This makes cryo-TEM a powerful orthogonal technique to complement your characterization toolkit.
Integrity and Impurities
Cryo-TEM imaging enables direct visual assessment of particle integrity and the detection of impurities in your formulation. Broken capsids, fragmented membranes, free payload, and other structural defects are clearly resolved on a per-particle basis, providing confidence in sample quality that bulk methods cannot offer. Integrity assessment can also reveal the impact of storage conditions, including pH, temperature, and time, on particle structure.
Aggregation
Cryo-TEM provides direct visualization of aggregation levels within your nanoparticle formulation. Per-particle imaging reveals whether aggregation is present, the extent to which particles are clustering, and which particle populations (e.g. empty vs. full capsids) are more prone to aggregation. Understanding aggregation status is critical for optimizing formulation stability, ensuring safety, and meeting regulatory standards.
Example of Samples We Can Image
- Adeno-Associated Virus (AAV)
- Adenovirus
- Bacteriophage
- Extracellular Vesicles & Exosomes
- Gold Nanoparticles
- Human Papillomavirus (HPV)
- Iron Nanoparticles
- Lentivirus
- Lipid Nanoparticles (LNPs), with mRNA, RNA, DNA payloads
- Liposomes
- Micelles
- Polymeric Nanoparticles
- Protein Based Nanoparticles
- Two Component Systems (such as adjuvanted formulations)
- Vesicular Stomatitis Virus (VSV)